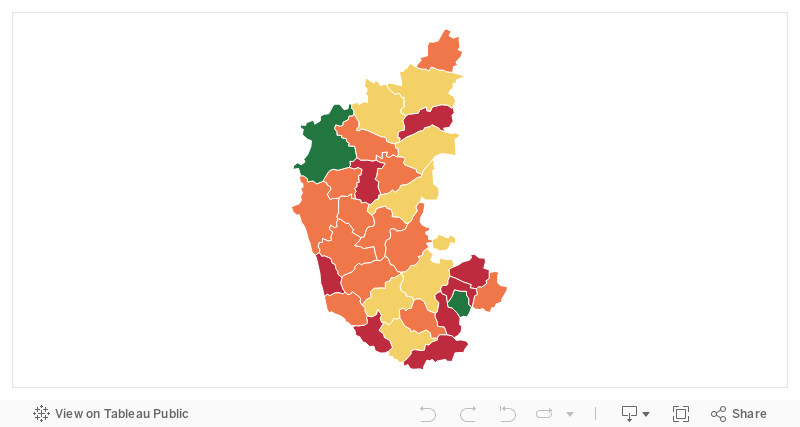
SDG 6
Clean water and sanitation
Legend
 High clean water and sanitation
 Moderate clean water and sanitation
 Low clean water and sanitation
 Very low clean water and sanitation
![]() Information unavailable
Information unavailable
Description
Ensure availability and sustainable management of water and sanitation for all.
Indicators
- Percentage of population using safely managed drinking water services.
- Percentage of population using safely managed sanitation services including a hand-washing facility with soap and water.
- Percentage of wastewater safely treated.
- Percentage of bodies of water with good ambient water quality.
- Percentage change in water use efficiency over time.
- Percentage of total available water resources used taking environmental water requirements into account (level of water stress).
- Degree of integrated water resources management implementation (0- 100).
- Percentage of change in the extent of water-related ecosystems over time.
- Amount of water-and sanitation- related official development assistance that is part of a government coordinated spending plan.
- Percentage of total projects/schemes run and managed by participation of local communities with established and operational policies and procedures for participation of local communities in water and sanitation management.